
Video and Digital Imaging Labs
(ViDi Labs ABN 8382601595)
(ViDi Labs ABN 8382601595)

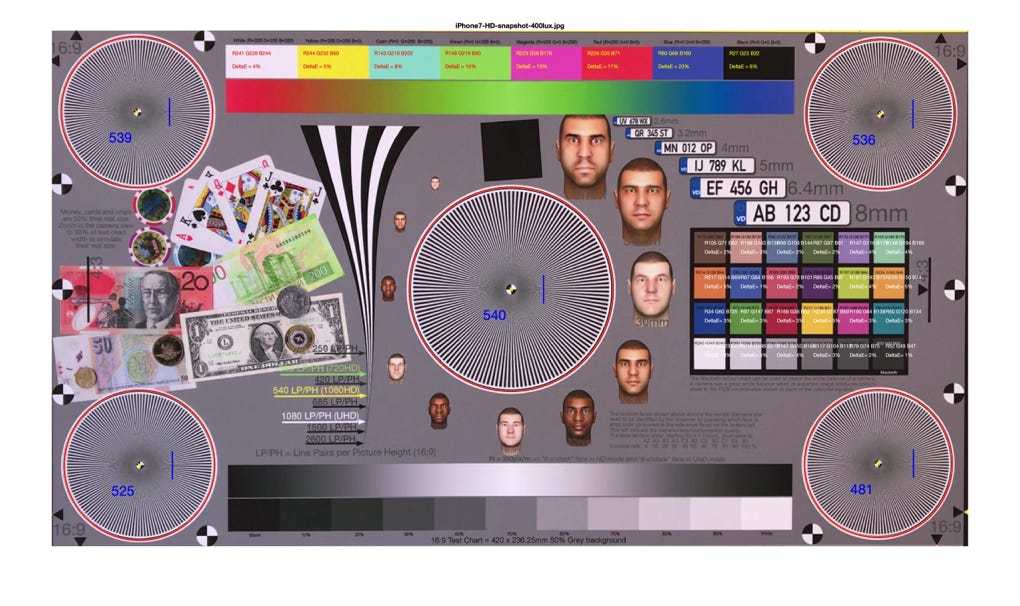
This is the latest test chart dedicated to the IP CCTV industry, compliant with the latest 62676-5 standards.
It consists of many innovations and details for easy and quick camera evaluation, testing and comparison.
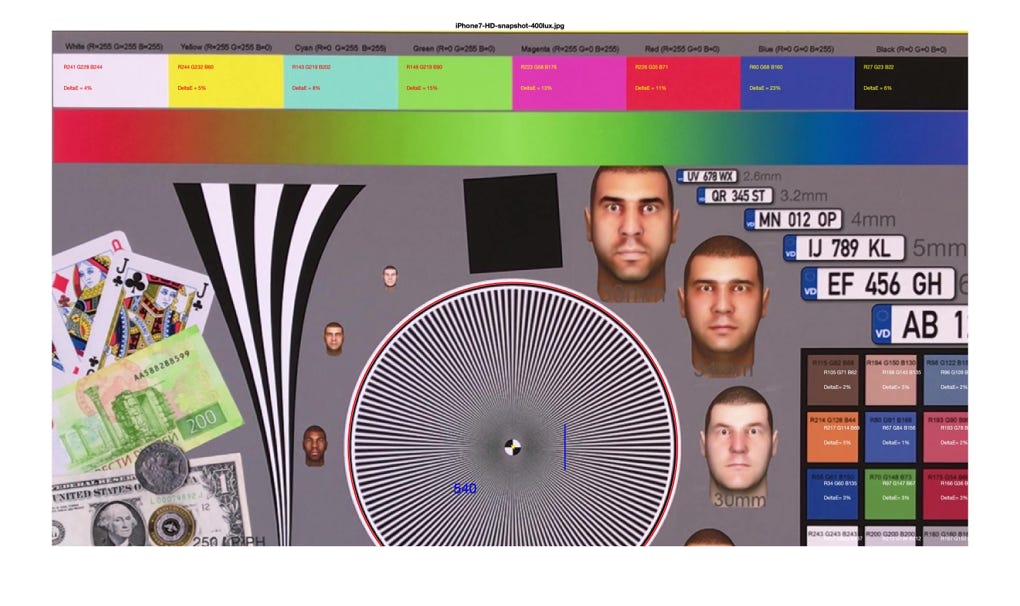
- Five continuous sine-wave Siemens stars for accurate measuring resolution with our new software;
- Face targets as per UK Home office for visual face identification;
- Macbeth colour chart, ideal for skin colour camera evaluation;
- Our famous continuity coloured and monochrome strips for checking Gamma and compression artefacts;
- Money and playing card samples for banks and casinos;
- Various size number-plates and much more.
- Free software report from your exported images of the test chart.
- NEW: Object motion analysis with rotating of the A3 size test chart
It comes in A3 and A1 size, and can be shipped world-wide.
Download the product manual below for more details.

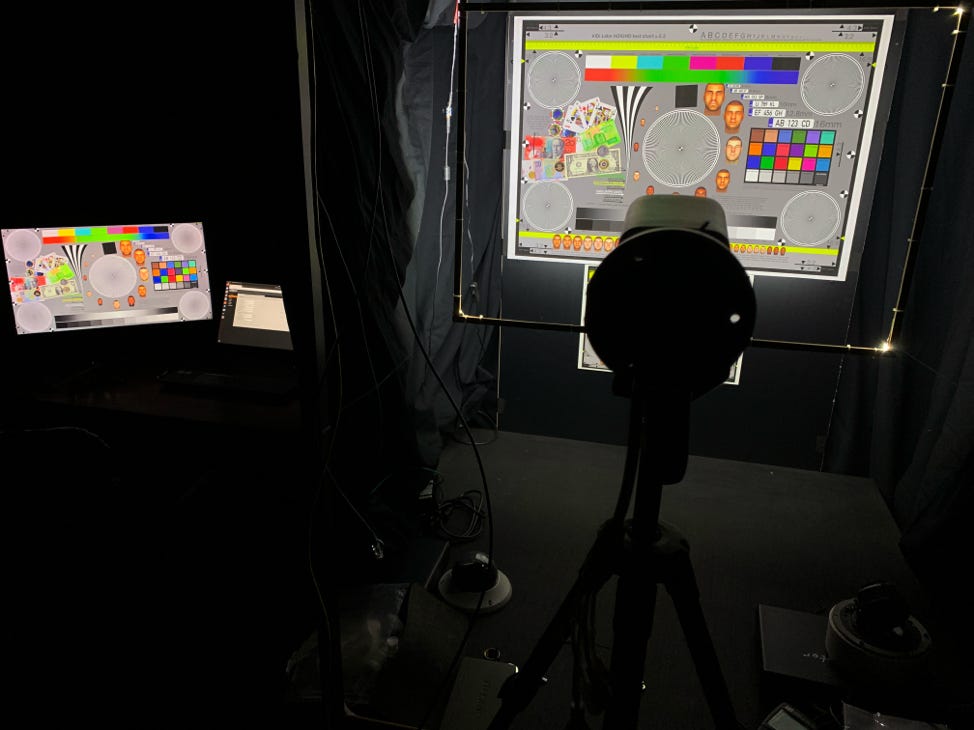
ViDi Labs is well equipped with instruments and tools to perform correct IP camera tests, as per various standards, including the latest IEC 62676-5.
We use our own HD/UHD test charts as well as our partner’s, Image Engineering, charts.
Calibrated lux-meters and high luminance light sources are also a component of our lab.
We recently developed our own software, based on MatLab algorithms, for accurate and objective camera analysis.
There is no need for guess work any more, like in the analogue days.
We conduct independent and confidential camera analysis for your next project or tender bid.
Our analysis is ideal when you wish to compare different cameras and decide which one is the better one.
But also we can help you choosing the best camera settings for the particular application. Factory default settings on many cameras are not always the best choice. When we do such analysis, we then save the camera settings and give you a configuration for such a camera, for the desired application.
If you wish to conduct your own testing and measurements, all you need to do is order our ViDi Labs test chart v.5.x, do you own video capturing of it and then send us a video or exported JPG images from your camera for our software analysis, free of charge.
FREE Software analysis of cameras from the exported image of the ViDi Labs test chart v.5.x
Once you order the latest test chart v.5.x, you can export your test images from your camera, send it to us and we will produce a free lab evaluation with our new software for up to ten different cameras.
The evaluation will include resolution, colour reproduction quality, gamma grey-scale, noise and continuous tone reproduction, all compliant with the latest standards IEC 62676-5.
For the first time in our industry, you can produce objective camera testing reports using our new software, free of charge.
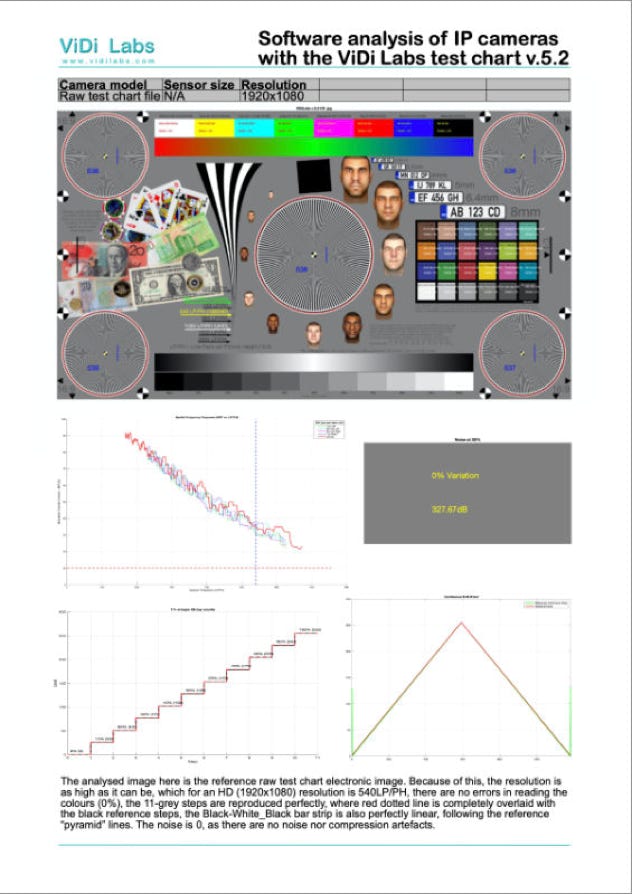
This is a free to download PDF illustrating how the ViDi Labs test chart v.5.2 is analysed by our software which produces objective evaluation report.
Ideal for large projects when you need to decide which camera to use for the best outcome.
It is also very useful for choosing the best camera settings for a given application.
This is a free report which we offer for all customer that have purchased our test chart v.5.2. Export an image from your camera and send it to us.
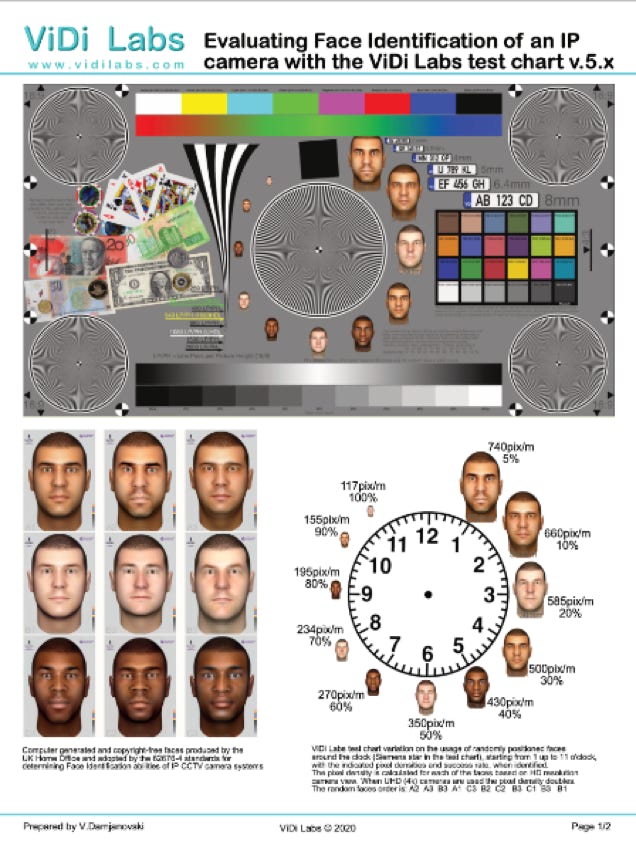
This is a free to download PDF illustrating how the ViDi Labs test chart v.5.2 can be used for visual evaluation of the Face Identification ability of a typical 1/3” IP HD camera.
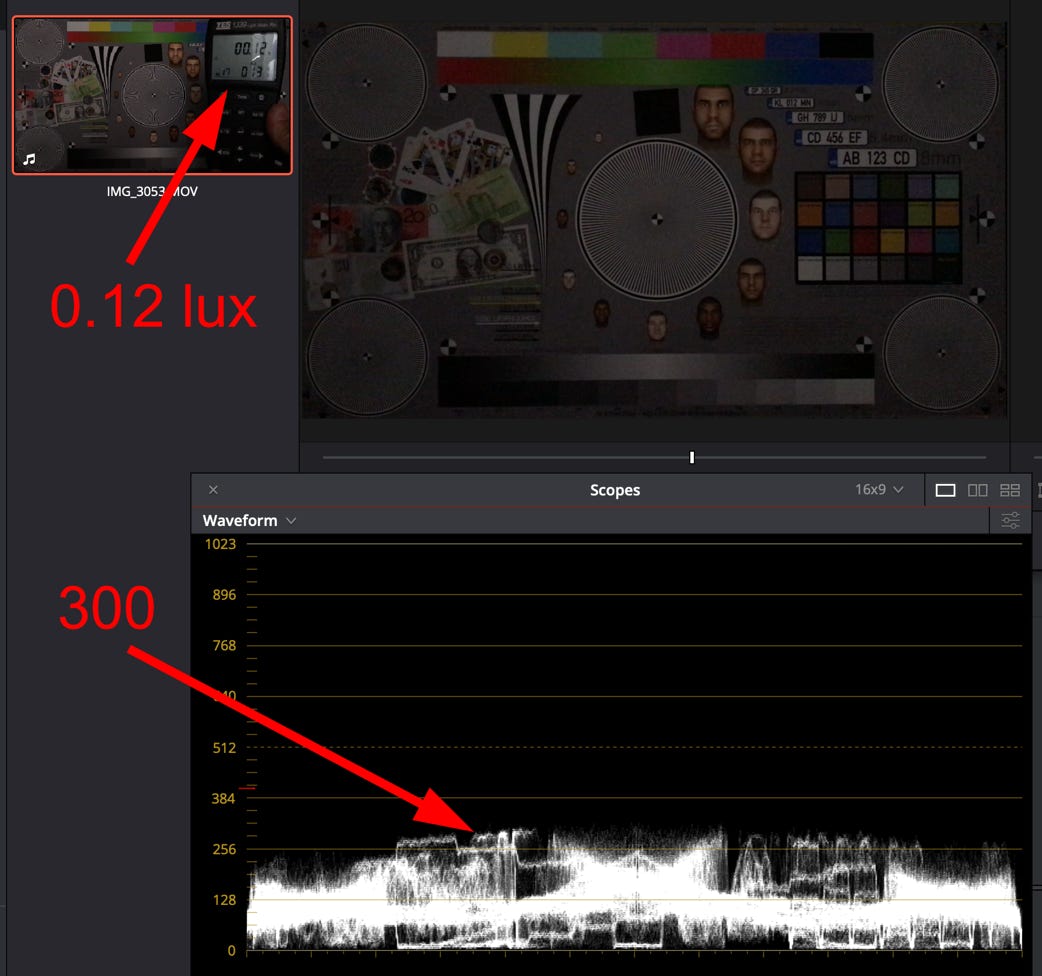
Based on the latest 62676-5 standard our test chart can also be used for measuring the minimum illumination, defined at 30% of the luminance level video.
A new methodology for camera analysis of moving objects using rotating test chart
Moving objects in CCTV
Everything of interest in CCTV moves, people, vehicles, animals, etc...
This means that motion artefacts, such as motion blur, or compression artefacts, may affect the picture clarity of moving objects. This, indirectly, affects the pixel density recommended by the IEC 62676-4 standards.
We have been a vocal advocate of the need to increase the pixel density from the current 250pix/m, to at least 350pix/m. With this test study we have one more proof that such an increase is desperately needed, especially if we want to keep our industry accountable for the projects we design and offer to clients.
After many years of research and study we derived the "Motion Blur" formula which we have included in the ViDiLabs calc application (available from iTunes and Google Play stores). Based on this formula, we conclude that an object moving with a speed V at 1m distance, for example, seen from the camera perspective will produce the same pixels blur as 10 x V at 10m distance, or 100 x V at 100m distance.
Using this knowledge, we have developed a new methodology, first in the world, which uses a test chart to evaluate camera image quality of moving objects.
With the rotating ViDi Labs test chart v.5.x, with faces and number-plates around the central Siemens star (where faces are at a radius distance of 65mm and licence plates are around 100mm~110mm from the centre of the test chart), and using various rotational speeds, we can simulate and evaluate almost any real object movement at any distance. Furthermore, we can also apply controlled light, from very low to high, for better understanding of various cameras processing artefacts at various light levels.
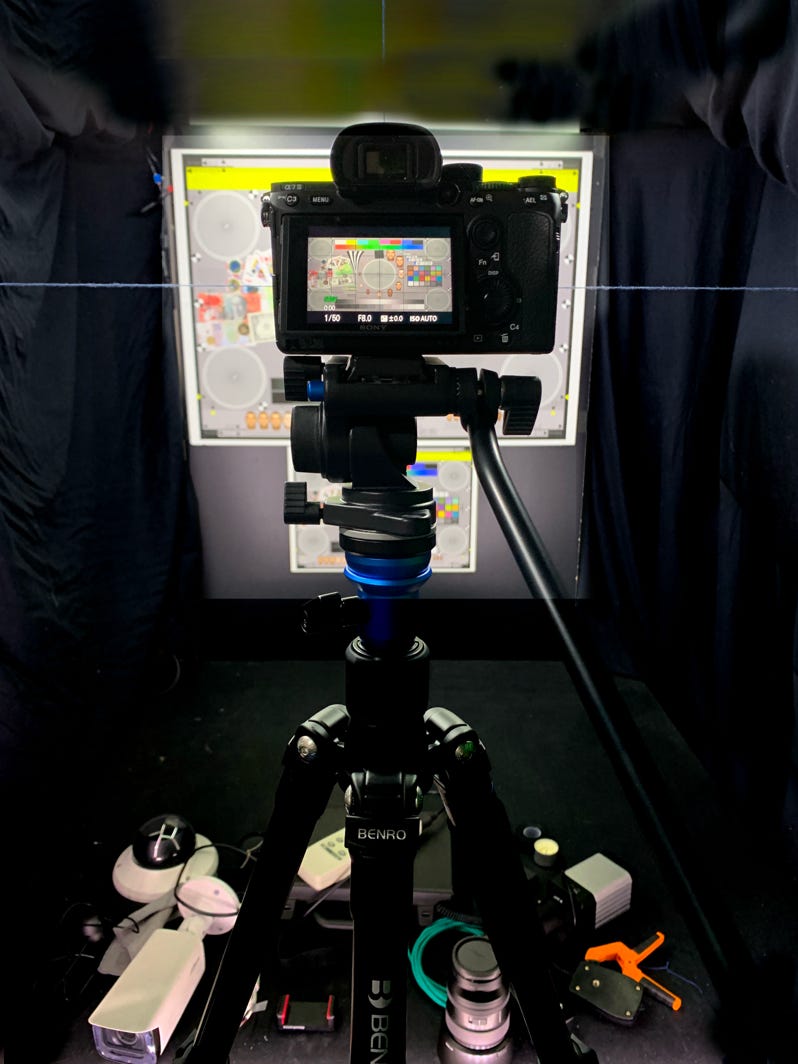
In this example, we illustrate a test we made in our labs with a typical 4MP IP camera (with a 1/3" sensor @ 2688x1520 pixels) where the test chart is mounted on a rotating assembly, 60cm away from the camera (Dc), and the charts revolves one revolution per 4 seconds (0.25 rev/s).
The resultant tangential speed of the faces is 0.1m/s (0.36km/hr) and of the licence plates 0.157m/s (0.57km/hr).
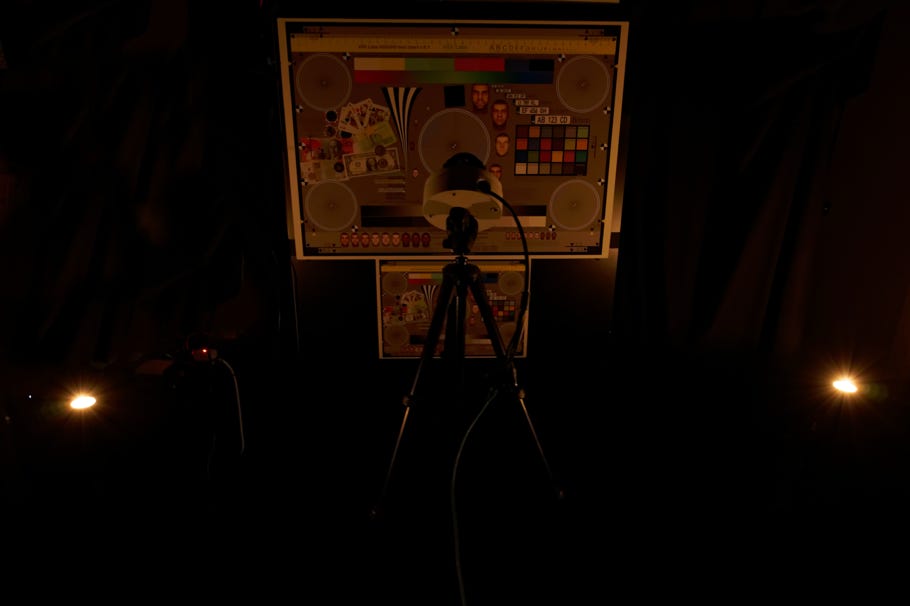
In the illustrated jig, we made tests at 1lux and 100 lux reflected light.
We are now claiming that the apparent motion speed at the test chart can be projected onto a real object with a real speed at a given distance in order to test the camera performance in recognition or identification of objects.
This can be applied to the most common objects in CCTV: faces, number-plates, cards and money (which are a part of our test chart v.5.x), but other objects can also be analysed with the same methodology.
The main conclusion from the tests we conducted are that even at good light of 100lux and using very short exposure of 1/500s or 1/1000s to minimise motion blur, the bottom faces of the test chart, located at 7 o'clock can be hardly identified, despite this being equivalent to Pixel Density of 380pix/m for this sensor of 4MP, using the best compression settings at 6Mb/s.
This is even less possible for the face at 8 o'clock, which would be equivalent 330pix/m.
So, based on these practical tests, it is very obvious that there is absolutely no possibility of identifying a running person at 9 o'clock face location, which is equivalent to 270pix/m.
Knowing that the current IEC 62676-4 standard recommends only 250pix/m for face identification, we can conclude that this will be hardly possible in a real situation, especially if we have moving (running) person, and even less if we have low light situation.
With these tests we have proven that the current IEC 62676-4 standard pixel density for Face Identification of 250pix/m is insufficient to claim any ability of identification and it should to be increased to at least 350pix/m, as suggested by us in the submitted Corrigendum document to IEC in 2018.
Our Maths
In our current test, we had our chart revolving at 1 revolution in 4 seconds, which produced a tangential speed at the faces circle:
Vf = faces rotation = 0.36km/hr
The camera we used for this test (4MP @ 1/3" sensor) is a typical 4MP camera (2688x1520 pixels) of a major manufacturer.
From the Motion Blur formula, which is embedded in the ViDiLabs calculator, and using the known distance to the revolving test chart of 0.6m, we can "project" the rotational speed of the faces and number-plates of the test chart, to real moving objects in front of the camera, with proportional speed and distance.
So for example, based on our ViDi Labs calculator, the correct distance for face identification with the chosen camera and sensor is 11m. If we divide this distance with the actual rotating test chart distance from the camera, we get the multiplication factor of: 11m : 0.6m = 18.3.
This means that a person at 11m distance from the camera, running with a speed of 7.6km/hr at angle of 60˚ relative to the optical axis is the same as the rotating faces on the test chart at tangential speed of 0.36km/hr (0.36km/hr x 18.3 = 6.59 / sin 60˚ = 7.6).
We chose an arbitrary 60˚ angle of the running direction just as an example, because there is a chance that a person's face can be seen at such an angle, instead if the person runs perpendicular to the optical axis, when we would only get the profile. So the tangential speed of the faces on the test chart, at 60cm, is equivalent to a person running with 7.6km/hr at an angle of 60˚ relative to the camera optical axis. Arguably, 7.6km/hr is not even fast running, and yet it shows that even at such a low speed the face can not be captured with sufficient details to be identified.
Similarly, we can find that the equivalent distance for licence plates recognition (at 300pix/m) the vehicle should be at approx.13m distance. From here, the multiplication factor is: 13m : 0.6 = 21.7.
This means that our simulated speed from the test chart rotation of 0.57km/hr, when projected to 13m is equivalent to a vehicle speed of 0.57km/hr x 21.7 / sin60˚ = 14.3km/hr. This certainly is a very low speed for a vehicle, and although our main intention in this test was to analyse face identification issues, it can be deduced that faster and more realistic vehicles speeds can simply be simulated with test chart rotation four times the speed (i.e. 1 rev/s) which will produce four times the equivalent motion speed at 13m distance, which yields 4 x 14.3km/hr = 57km/hr. In our test equivalent to 14.3km/hr, we can clearly see the number-plates only with exposures of 1/100s or shorter picks all number-plates in the top right hand side.
As it can be seen, with this method, many different real life situations can be tested and verified.
ViDi Labs © 2025
